China’s proportion of domestic and foreign past due B2B invoices is almost in line with the regional average and has increased compared to last year.
China has been rebalancing its economy away from investments and exports towards consumption. This has caused a slowdown in GDP growth, from 10.6% in 2010 to 6.7% in 2016. After an uptick in growth in 2017 driven by higher investment, we expect growth to slow down further in the medium term. After the Communist Party Congress in the fall of this year, authorities are expected to rein in credit growth. According to our survey results, the potential impact of this development seems to be one of the main reason of concern for suppliers within the country as well as those in countries trading with China.
Sales on credit terms
In 2017, there has been a minor increase in the percentage of B2B sales on credit terms in China. Still, with a percentage of 40.7% of sales on credit terms, China remains the Asia Pacific country surveyed in which respondents are the least likely to use this method of payment.
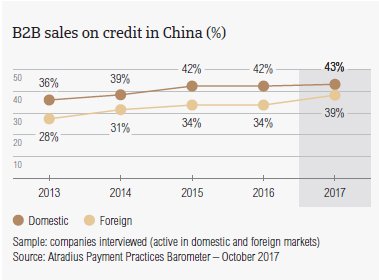
- Respondents in China reported that, on average, 42.7% of the sales to their domestic B2B customers was transacted on credit. This is slightly above the 42.0% registered one year ago.
- The percentage of B2B sales on credit to foreign customers also increased from 34.4% last year to 38.6% in 2017.
- Like their peers in the Asia Pacific region, Chinese respondents’ aversion to selling on credit is slightly more focused on foreign than on domestic transactions.
- Compared to the regional averages (domestic: 49.5%; foreign: 42.2%), respondents in China are less likely to sell on credit terms to both their domestic and foreign B2B customers.
Overdue B2B invoices (%)
In 2017, respondents in China reported an increase in the proportion of past due receivables from both their domestic and foreign B2B customers.
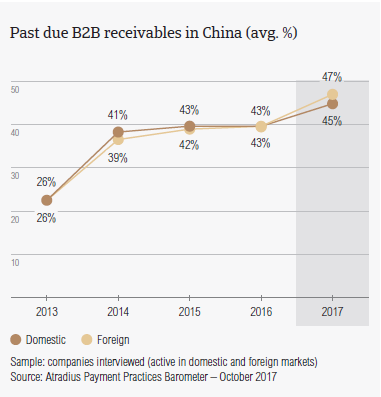
- The percentage of respondents who have reported late payments from their B2B buyers in China (95.0%) is higher than the regional average (89.2%) and has increased compared to 2016 (91.5%).
- On average, 44.6% of domestic invoices and 47.4% of foreign invoices remained unpaid at the due date. The country’s proportion of domestic and foreign past due B2B invoices is almost in line with the regional average (domestic: 44.6%; foreign: 46.1%) and has increased compared to the same period last year (domestic: 43.0%; foreign: 43.3%).
- In 2017, China’s Days Sales Outstanding (DSO) figure averaged 33 days. This is six days shorter than in 2016 and indicates that respondents in the country have to wait almost one week less than in 2016 to turn B2B receivables into cash.
- Moreover, the average DSO in China is lower than the average for Asia Pacific overall (40 days). This difference was not as big in 2016, when the DSO figure in China was three days shorter than the regional average.
- Looking forward, most respondents in China (48.4%) do not expect a change in their average DSO over the next 12 months. However, 34.6% expect a slight increase over the same time frame while 6.5% are more optimistic and expect a slight decrease in their average DSO.
Payment duration (average days)
In 2017, domestic B2B customers of respondents in China had to fulfil their payment obligations faster than in 2016 while foreign B2B customers enjoyed average payment terms similar to those given in 2016. Payment delays have been reported to have decreased slightly.
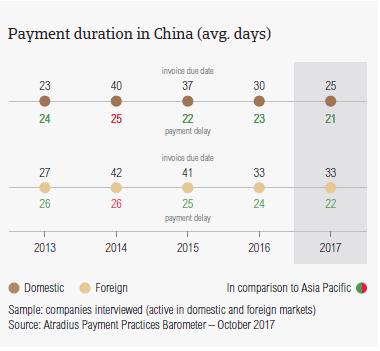
- Average payment terms granted to domestic B2B customers in China have been shortened by five days compared to 2016 levels. In 2017, respondents in China asked their B2B customers to pay their invoices within 25 days.
- Like in 2016, foreign B2B customers of suppliers in China had, on average, 33 days, to pay their invoices.
- Respondents in China reported a small decrease in the average payment delays of their domestic and foreign B2B customers. Domestic B2B customers of respondents in China delayed payments, on average, by 21 days (2016: 23 days). Foreign B2B customers delayed payments, on average, by 22 days (2016: 24 days).
- Due to the changes in average payment terms and payment delays, suppliers in China needed to wait 51 days to turn B2B receivables into cash. This means that payment duration in China improved compared to the year before (55 days).
- When compared to the regional average of 55 days, in 2017 respondents in the country had a quicker credit to cash turnaround.
Key payment delay factors
Respondents in China cited insufficient availability of funds as the key payment delay factor by domestic B2B customers. The main payment delay factor cited in respect to foreign B2B customers was inefficiencies of the banking system.
- In China, payment delays by domestic B2B customers seem to have occurred primarily because of insufficient availability of funds (cited by 41.5% of respondents) and the inefficiencies of the banking system (39.0%).
- Looking at payment delays by foreign B2B customers, 41.9% of respondents in China said that delays occurred mainly because of the inefficiencies of the banking system. The second most cited reason (35.9% of respondents) was the complexity of the payment procedure.
- The top two reasons for payment delays in China don’t differ too much from those reported at regional level; where domestic B2B customers delayed payments mainly because of insufficient availability of funds (43.8%) and the complexity of the payment procedure (27.4%) and foreign B2B customers because of the complexity of the payment procedure (34.9%) and insufficient availability of funds (33.3%).
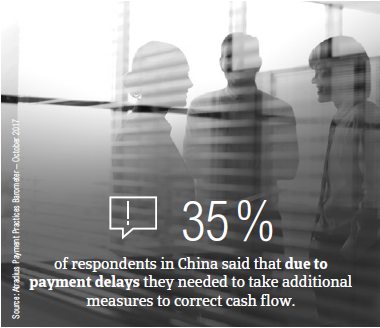
- A low 12.0% of respondents in the country said that payment delays did not have a significant impact on their businesses. 25.0% said that late payments caused a loss of revenue and 35.0% said that they needed to take specific measures to correct cash flow.
Protection of business profitability
Next to their peers in Indonesia and India, respondents in China are some of the most likely in the Asia Pacific region to increase their use of credit management practices to protect themselves against risks stemming from Brexit, US protectionism and the slowdown in Asia.
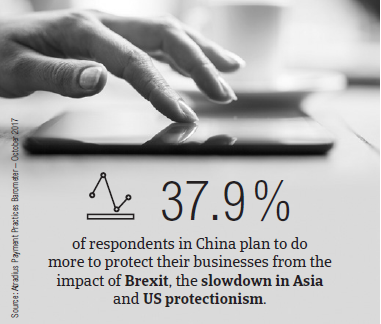
- 37.9% of respondents in China (30.3% at regional level) plan to increase their use of credit management tools in the face of the above-mentioned developments. This is a slightly higher percentage than that of Chinese respondents stating that they will make no changes (36.2%).
- The preferred credit management tools are increasing checks on buyers’ creditworthiness (stated by 42.2% of respondents) and increasing their use of credit insurance (41.8%). At regional level, the preferred credit management tools are increasing checks on buyers’ creditworthiness (36.1%) and increasing monitoring of buyers’ credit risk (34.0%).
- With the US as a main trading partner, respondents in China seem to be most concerned about the risks stemming from US protectionism. 47.9% stated that they will make more use of credit insurance and 46.8% that they will increase checks on buyers’ creditworthiness.
- In contrast, Brexit seems to be the least likely to spur respondents in China to adjust their credit management practices (increasing creditworthiness checks: 33.6%; increasing their use of credit insurance 33.2%).
- To manage potential risks stemming from the slowdown in Asia, 46.1% of respondents in China stated their intention to increase creditworthiness checks on their buyers and 44.2% their use of credit insurance.
Uncollectable receivables
The total value of B2B receivables written off as uncollectable in China increased from 1.8% in 2016 to 2.0% in 2017. A minor increase was observed in most of the Asia Pacific countries surveyed with the exception of Singapore, Indonesia and India.
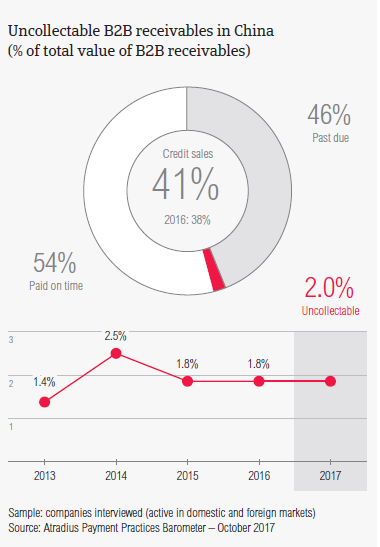
- Similarly to what was observed in previous surveys, in 2017, domestic receivables were written off as uncollectable more often than foreign ones (domestic: 1.3%; foreign: 0.7%). This shows a minor increase in the value of both domestic and foreign write-offs compared to 2016 (domestic: 1.2%; foreign: 0.6%).
- When compared to the regional averages (domestic: 1.5% and foreign 0.6%), the total value of uncollectable receivables in China is slightly lower.
- Uncollectable receivables in China originated most often from B2B customers in these sectors: consumer durables, construction, chemicals and services.
- Respondents in China reported that the main reasons why B2B receivables were uncollectable were: the customer going bankrupt or out of business (reported by 45.0%), the failure of collection attempts (37.9%) and the old age of the debt (37.9%).
Payment practices by industry
Looking ahead, more respondents in China seem to expect an improvement than a deterioration in the payment behaviour of their B2B customers over the coming 12 months.
- Respondents in China granted B2B customers in the electronics and financial services industries the longest payment terms (on average, 35 days); six days longer than the 29 days average for the country overall.
- In contrast, B2B customers in the paper (15 days), chemicals (17 days) and food (18 days) sectors were asked to fulfil their payment obligations the fastest.
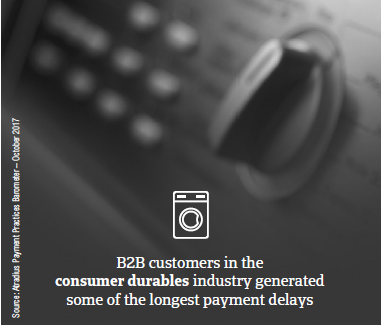
- Customers in the consumer durables and machines sectors generated some of the longest delays. B2B customers in these sectors, paid on average 39 and 22 days late respectively.
- The main reasons for payment delays in the consumer durables sector seem to be the complexity of the payment procedure (cited by 39.0% of respondents) and insufficient availability of funds (31.0%).
- In the machines sector, the most frequently cited reason for late payment of invoices was the inefficiencies of the banking system (cited by 62.0% of respondents), followed by insufficient availability of funds (51.0%).
相关资料

3.37MB PDF

8.12MB PDF